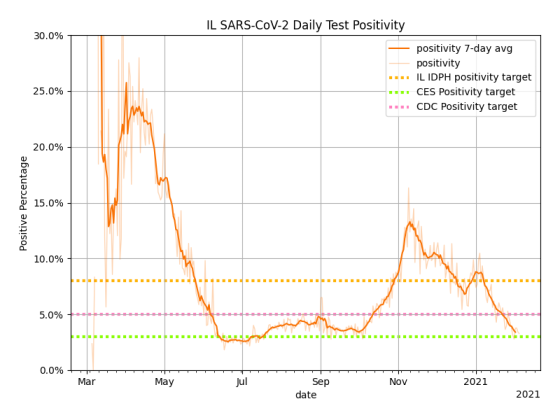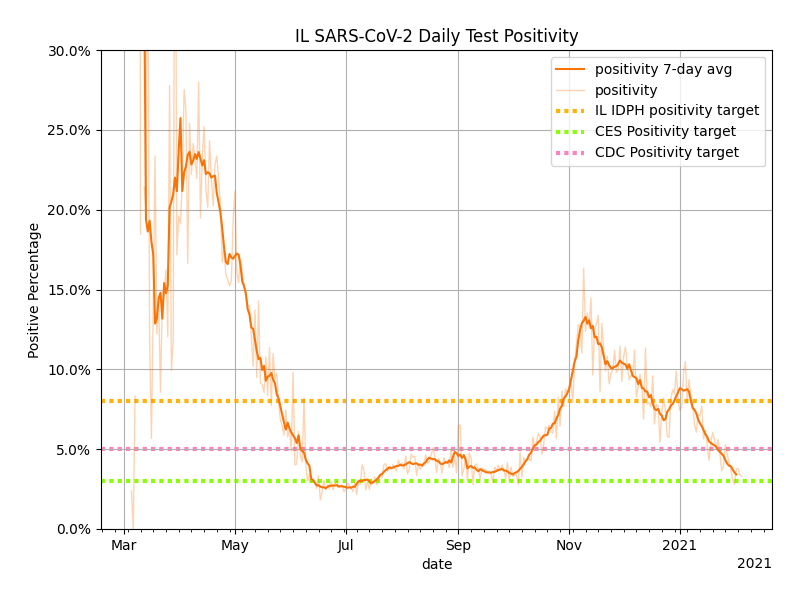
Some of you may know that I tweet out COVID-19 statistics and commentary once a week. One of my goals with this blog — and by extension, my Twitter stream — is that no one should be stupider for having read it. Since I’m not a professional epidemiologist, I try not to get too far outside the data in reaching for things to say. In particular, I have avoided the temptation of trying to model the COVID-19 epidemic. This means that all my charts are showing descriptive statistics, such as historic test positivity (the percent of tests that are positive) here in Illinois:

The thick orange line is a 7-day moving average of the test positivity, with a fainter orange line showing the actual daily reports of test positivity. The three dashed horizontal lines are positivity targets set by various organizations.
- The top line, at 8%, is the target used by the Illinois Department of Public Heath for setting re-opening rules.
- The middle line, 5%, is a target recommended by the CDC for adequate testing.
- The bottom line, 3%, is the target where the Covid Exit Strategy think tank believes that public health measures (test, trace, isolate) can suppress the disease.
So, I calculated the main positivity data line directly from testing data I pulled from the Covid Tracking Project, whereas the more theoretical target lines are based on calculations, models, and rules of thumb created by professionals in the field.
Recently, I’ve started posting time-series charts of vaccination data, and I’ve found they don’t tell me what I really want to know, which is how much of the U.S. population is now immune from COVID-19. I think I can make an estimate of that, but it’s not a simple calculation, and there are some assumptions.
In other words, it’s a model. And I figured I should document how I’m calculating it.
For my purposes, people are immune from the COVID-19 virus in one of three ways:
- Natural immunity, from having caught and recovered from COVID-19.
- Partial vaccination immunity from the first dose of vaccine.
- Complete vaccination immunity from the final dose of vaccine.
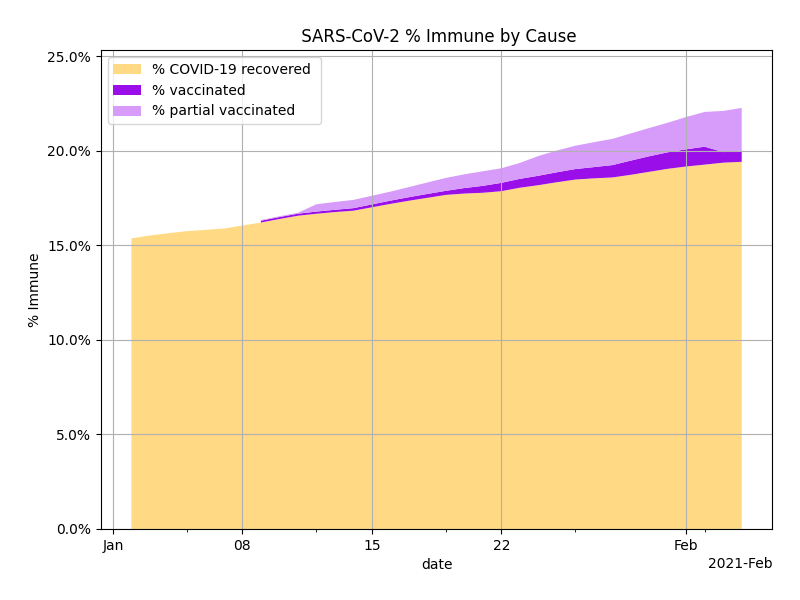
This is a super-simple model that only calculates a point estimate — I have no idea what the error range is. Here’s my latest immunity chart for the entire United States:

As you can see, only about 1% of U.S. residents are immune from having completed vaccination. The downward move at the end occurs because some states adjusted their reporting.
Methodology:
The simplest calculation is the number of people who are immune from having completed vaccination. I calculate the number of completely vaccinated people as the number of people who received their second dose, lagged by 7 days to give immunity time to develop. I then multiply by 95% to adjust for vaccine efficacy to get number of people immune from completing vaccination.
Calculating the number of people immune from partial vaccination is similar. I use the number of people who received the first dose, lag it by 10 days to give immunity time to develop, and then multiply by 46.5% (the average single-shot efficacy reported from Israel) to get the number of people immune from partial vaccination. For display purposes, I adjust that by subtracting the number of people who are immune from completing vaccination.
Finally, I calculate the number of infected people. Since COVID-19 testing was inadequate for the first few months (and perhaps a few times afterward) I calculate the number of infected people by working backward from a less ambiguous number: The number of dead people. I assume an Infection Fatality Rate of 0.65%, meaning that about 0.65% of people who catch COVID-19 die from it, and then I divide that into the number of deaths to estimate the infection rate. I assume that the average death occurs 19 days after the date of infection. If that turns out to be less than the number of people who tested positive, I use the positive test count instead. Then I assume that everyone who has not died by day 22 is going to recover and will be immune by then. This gets me the natural immunity figure. In the absence of better data about reinfection, I assume that 100% of recovered COVID-19 victims are immune.
I assume that people who’ve had COVID-19 receive the vaccine at the same rate as the general population, and I adjust for the overlap by deducting vaccinated COVID-19 recoverees from total recoverees, essentially assigning their immunity to the vaccine rather than natural immunity.

Leave a Reply