
If you know anything about graphic presentation of data, especially if you’ve read Edward Tufte’s Visual Display of Quantitative Information, you know that there are lots of ways to cheat to make the data appear to support your argument more than it really does. But James Parks at the AFL-CIO Now Blog has a post about the need to close the wage gap between men and women which goes beyond mere graphic cheating. This graph is a sin:
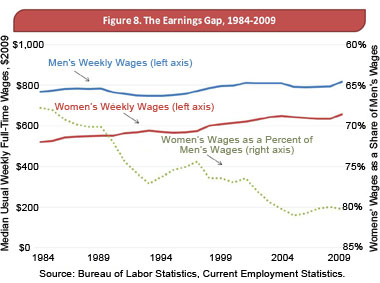
A quick glance shows that men’s and women’s wages are graphed against the left-hand scale. As you can see, both show a slight rising trend in constant dollars. The gray dashed line shows women’s wages as a percentage of men’s wages, and it’s declining, which seems to show a loss of parity for women. This is odd, because the colored wage lines above are visibly getting closer together. Also, we may not be living in a paradise of equality, but does anyone who’s been paying attention for the last 25 years really think things have gotten worse for women?
The explanation for this mystery becomes apparent when you realize that the gray line showing women’s wages is plotted against the right-hand scale, which is printed upside down. Women’s wages are in fact rising slightly faster than men’s wages, so if the scale was printed correctly, the graph would be slanting up. Unless you resort to outright fabrication, data presentation doesn’t get more deceptive than this.
[Update: More here, including James Park’s apparent source for that misleading graph.]
(Note: Such a broad-based comparison between men and women is nearly useless anyway, even if printed correctly, unless you control for things like age, education, the type of job, and years of experience.)
(Hat tip: Steve Landsburg)
Leave a Reply