I’ve seen people complaining about the epidemic models used to plan the Covid-19 response here in the United States, much of it along the lines of “Early predictions of dire overcrowding of hospitals and 100,000 to 250,000 dead have been revised downward to 61,000 dead, which is no worse than a bad flu season, yet we shut the country down.” Sometimes this is a sincere concern, but often it’s accompanied by an accusatory and partisan tone, as if epidemiologists — and of course the media who repeat their estimates — are trying to scare people to destroy the economy, enact the New World Order, or make Trump look bad.
Dr. Fauci and company told President @realDonaldTrump we were going to lose 200,000 to 2M people as a result of #coronavirus. Today @NIH revised those numbers to about 60,000. 17M people have lost their jobs and our economy has been decimated. Why is #DrFauci still there?
— Bernard B. Kerik (@BernardKerik) April 9, 2020
Dr. Fauci and company told President @realDonaldTrump we were going to lose 200,000 to 2M people as a result of #coronavirus. Today @NIH revised those numbers to about 60,000. 17M people have lost their jobs and our economy has been decimated. Why is #DrFauci still there?
— Bernard B. Kerik, @BernardKerik
First of all, for someone who’s so angry about epidemic models, these people sure are eager to use an epidemic model to make their point. As I write this, about 20,000 Americans are reported to have died from Covid-19 infections, so that figure of 60,000 is just a prediction someone made. Kerik hasn’t cited his figures, but I’m guessing that most people complaining about model estimates near 60,000 are taking that figure from the popular IHME model, which currently has a central prediction of 61,545 deaths (with a 95% confidence interval of 26,487 to 155,315). So these people are getting angry about a model prediction because of another model’s prediction. And even by that prediction, we’re only about 1/3 of the way into the death toll from the first wave of the epidemic.
Nobody says COVID-19 is not real, that it can't tax hospitals or kill people, esp. if they are over 75 or have comorbidities. But right now the best CURRENT projection is for 61,000 US deaths. That was the 2017 flu season. Why have we shut the country?https://t.co/OMStr4jd6i
— Alex Berenson (@AlexBerenson) April 9, 2020
Nobody says COVID-19 is not real, that it can’t tax hospitals or kill people, esp. if they are over 75 or have comorbidities. But right now the best CURRENT projection is for 61,000 US deaths. That was the 2017 flu season. Why have we shut the country? https://cdc.gov/flu/about/burden/2017-2018.htm
— Alex Berenson, @AlexBerenson
As everyone keeps pointing out, shutting things down is the reason the projections are at 61,000. The IHME projections are based on the assumption of shutting down. It literally says “COVID-19 projections assuming full social distancing through May 2020” at the top of every page of the projection visualization.
It’s certainly possible the model overestimates the benefits of the shutdown, but if you object to that assumption, it’s logically incoherent to try to support your argument with numbers produced by a model using the very assumption you’re trying to dispute.
The most overly broad response I’ve seen so far is from Senator John Cornyn:
After #COVIDー19 crisis passes, could we have a good faith discussion about the uses and abuses of "modeling" to predict the future? Everything from public health, to economic to climate predictions. It isn't the scientific method, folks. https://t.co/OYBm3CIUxX
— Senator John Cornyn (@JohnCornyn) April 10, 2020
After #COVIDー19 crisis passes, could we have a good faith discussion about the uses and abuses of “modeling” to predict the future? Everything from public health, to economic to climate predictions. It isn’t the scientific method, folks. https://en.wikipedia.org/wiki/Scientific_method
— Senator John Cornyn, @JohnCornyn
Here’s the problem with what the Senator is saying: Every time you plan for the future — figuring out if you can afford new car payments or deciding when to take your skiing vacation — you are basing your plan on a model. You have some mental idea of your future income and expenses, or of seasonal snowfall at your favorite ski resort. You may not give your model a name or write out equations or implement it in software, but it’s still a model.
And it’s not like there’s an alternative to using models. Economist Paul Krugman wrote a column about “accidental theorists,” people who scoff at academics and others for talking about abstract theories and simplified models. They claim they can understand the world and figure out what we need to do by “looking at the facts” and using “common sense.” But figuring out what to do requires making predictions about the future, and the future hasn’t happened yet, so we don’t have any facts. So by necessity these people are using a theory, but it’s one they have constructed without care, rigor, robustness, or testing…and apparently even without conscious knowledge that they are using a theory.
In the Wikipedia article “Scientific Method” that Cornyn links to, it mentions “formulating hypotheses.” A hypothesis is a type of model, and the formal scientific method is the means by which we test those models against reality. We do that because if we can build a model that describes known reality accurately, we can probably use it to make useful predictions about the as-yet-unknown reality of the future.
(Really bad theories are little more than wild guesses, but even wild guesses can be right some of the time. If you bet a number on a roulette wheel in Las Vegas, you have a 1 in 38 chance of winning, which means you will probably lose. But if enough people play any given spin of the wheel to cover all the numbers, someone will win and get real excited about it. When the Covid-19 epidemic in the US is over and done, and we get a final number on the death toll, some epidemiologist, pundit, or madman out there will turn out to have predicted that number, and they will get really smug about it.)
In her book, Lost in Math, physicist Sabine Hossenfelder explains why physicists use math, and it serves well as an explanation of why all kinds of scientists build models:
In physics, theories are made of math. We don’t use math because we want to scare away those not familiar with differential geometry and graded Lie algebras; we use it because we are fools. Math keeps us honest—it prevents us from lying to ourselves and to each other. You can be wrong with math, but you can’t lie.
[…]
Using mathematics in theory development enforces logical rigor and internal consistency; it ensures that theories are unambiguous and conclusions are reproducible.
[…]
There are other reasons we use math in physics. Besides keeping us honest, math is also the most economical and unambiguous terminology that we know of. Language is malleable; it depends on context and interpretation. But math doesn’t care about culture or history. If a thousand people read a book, they read a thousand different books. But if a thousand people read an equation, they read the same equation.
When you build a model with math, implement it with algorithms, and publish the data, you’ve built a tool that other people can examine and critique and improve upon. And if it’s a good model, they can use it to make important decisions.
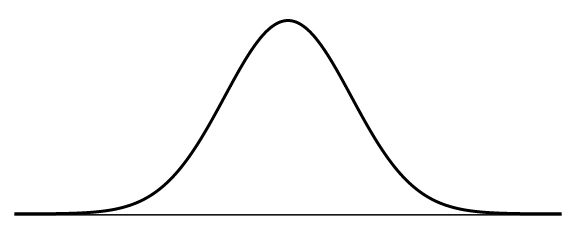
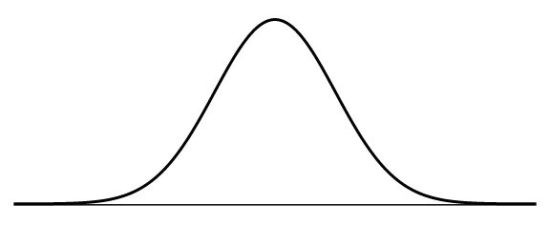
To see what all the fuss is about, let’s take a closer look at the IHME model that everyone’s talking about. It’s based on the general observation that when an epidemic hits a population, the death rate starts with just a few people and then explodes at a furious pace for a while until it peaks, after which it begins to decline until the death rate finally reaches zero and the epidemic is over. If you plot the number of deaths per day, it looks like a bell curve:
The IHME model assumed the Covid-19 death toll would follow a similar curve, but that alone is not enough. To make the model useful, you need to know more about the shape and size of the curve. How high is the peak (the maximum death rate)? How wide is it (how long does the epidemic last)? Are the sides really fast and steep or are they slow and shallow (how quickly does the virus spread)? The model itself is described in an equation (in this paper) and the answers to these questions are parameters to the equation.
To get these answers, you need data about the Covid-19 epidemic. The problem is that this is a brand new outbreak, so we have no historic data on how it behaves. All we have is what’s happening right now. and at the time this model was created, there was only one place in the world which had been far enough through the epidemic for scientists to have data about the shape of the bell curve: Wuhan, China.
In other words, the first version of this model implicitly assumed that the Covid-19 epidemic would follow the same pattern in the United States that it followed in Wuhan. The model does include adjustments for differences in age structures between Wuhan and US locations and differences in some social distancing measures, but it doesn’t account for lots of other differences such as population density, the prevalence of lung disease, or use of public transport.
But just understanding the shape of the Covid-19 model bell curve is not enough. In order to predict when the Covid-19 epidemic will peak in a particular region of the US, you have to gather data on Covid-19 death rates from that region. This data is incredibly messy: Health departments have different standards for what counts as a Covid-19 death, they miss reporting days, or they are late counting reports and some of the day’s deaths get reported the next day. Sometimes they go back and revise old reports. Anybody who has worked with raw data sets knows they always have problems like this.
But from that mess, model makers try to find usable data from which they can construct a local piece of the initial curve of the epidemic in that region. Then they try to match that curve to the shape of the full Covid-19 model bell curve to figure out where that region is on the Covid-19 model curve. Once they know that, they can use the model bell curve to calculate an estimation of when that region’s curve will reach the top and how high it will be, (i.e. how fast people will be dying). They can also estimate the area under the curve, giving them an estimated number of fatalities.
If that doesn’t sound like it will produce a very accurate prediction, you’re right. The IHME model authors are quite clear about this. They discuss problems with the model in their paper and on their website. Moreover, the error ranges in their results are huge. You know how when you see poll numbers, you often see an error range that looks something like “+/-3%”? That means that there’s a 95% chance that the actual number is within plus or minus 3 percent of the poll result. (I’m simplifying a bit.)
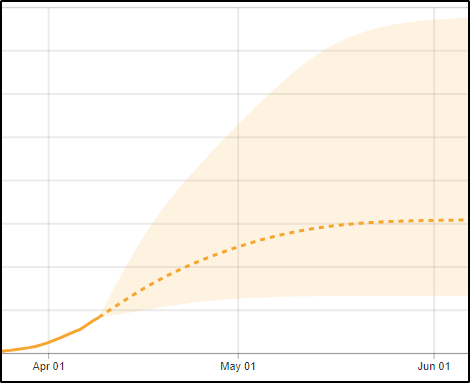
Well, the first IHME prediction was for 81,114 deaths, but the error range was from 38,242 to 162,106. (I have no idea which model predicted 250,000 deaths, but it was never this one.) That’s a confidence interval of -53% to +100%. The authors are careful to mention these confidence intervals almost every time they mention any model output, and the visualizations feature the error intervals prominently as shaded regions around the central predictions:
One of the reasons the range of the prediction is so huge is that the early death toll typically follows an exponential curve. It’s like compound interest, except instead of doubling in years, the death toll from Covid-19 has been doubling roughly every 3 to 6 days, depending on the region. That’s incredibly fast, and it makes predictions difficult. If the virus speeds up replication just a little and gets in just one extra doubling before it stops, that’s twice as many deaths.
Since the IHME first published this model, it has been revised several times. By now, 19 locations appear to have reached the top of their bell curves, giving the model a much more accurate and robust picture of the shape, and variations, of the Covid-19 bell curve. (And alleviating concerns about relying on the accuracy of the Wuhan data.) In addition, the model now has two more weeks of data on death rates in the US, which allows for a more careful fit of each region. (They’ve made other refinements as well.)
Finally, note that although the central predictions from this model started at around 80,000 deaths, shot up to over 90,000 deaths, and then came back down to about 60,000 deaths, both the high and low figures are well within the confidence interval of the original model result.
Epidemiologists have been building models of epidemics for over a century, and they’ve gotten pretty good at it. Compared to sophisticated modern modeling techniques (which I can’t claim to understand), the IHME model’s simple curve fit is almost absurdly primitive. But the problem with sophisticated models is that they have a lot more adjustable parameters describing the behavior of the infectious agent and the affected population, which means they require a lot more data to tune the model accurately enough to make it useful.
This epidemic has only been going on for four months, so a lot of the data hasn’t come in yet. With over 1.7 million people confirmed infected and over 100,000 dead, the data is out there, but a lot of it is sitting in hospital files and health department reports from different locations using different reporting protocols. Statisticians will need to spend a lot of time wrangling this data to build a data set that is accurate, consistent, and useful.
I think it will probably take years to get a complete picture of what happened in these first few months of the Covid-19 pandemic, but I hope that well before then we will have enough data to start building more sophisticated models. With the right kind of models, we should be able to estimate the effects of different strategies for monitoring and intervening in the Covid-19 epidemic, which will make the fight a little easier.

Thanks you for your clear and well written explanation of how modeling and the scientific method works. When I first saw the model in question published I was excited to finally see something that people could discuss critically and with reason instead of pre-established emotions. Of course it was twisted and lambasted by a subset of the readers but I applaud the authors for having the courage to publish it so quickly in the first place. I also appreciate your help in educating the world on how to understand these models, how they work and what they mean.
Thanks for the kind words. I like learning about new things and explaining them to people, so this was an interesting post to write. There’s always the danger of thinking I know more than I do, however, so I tried not to get too far away from the basics where I’m comfortable. So far, nobody’s told me I screwed anything up.