
A couple of days ago, I posted about this silly graph, which shows the wage gap between men and women:
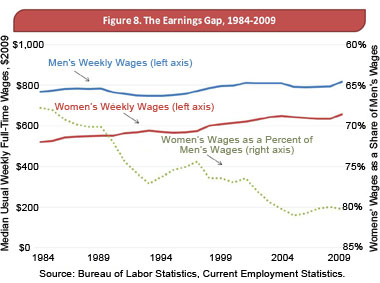
The dotted gray line on the graph at first seems to show that “Women’s Wages as a Percentage of Men’s Wages” are dropping, but that turns out to be because the dotted gray line is plotted against the right-hand scale, which is printed upside down, with the larger numbers at the bottom. I called this a sin against graph design.
My co-blogger Ken suggested in a comment that this might not be such a terrible sin:
I often run into a graph like that where the right-hand scale is reversed when reading scientific papers. It’s often used to emphasize a reduction such as this one. The graph clearly shows an overall reduction in the gap between wages and demonstrates the variations by time.
It’s actually a good graph, but fails to make the point James Park was trying to make. The question is if James Park created the graph with the intention of deceiving, or just copied the graph from an analysis done that Park failed to understand.
A little research indicates it was the second option. The graph appears to be Figure 8 from the report “Women and the Economy 2010: 25 Years of Progress But Challenges Remain” dated August 2010, which appears on the “Women and the Economy 2010 Series” website. The report is credited to “the Majority Staff of the Joint Economic Committee” of the United States Congress.
So, it’s your tax dollars at work. I imagine James Park probably just took the graph from that report without worrying too much about the details. After all, it’s from Congress, right?
In any case, it’s still a bad way to show data. I realize that data sometimes has to be massaged to show results–such as plotting data against a reciprocol or logarithmic scale–but inverting the scale like this just seems wrong, especially since you could just as easily plotted the size of the gap itself, which really would slant downward on a normally-oriented scale.
I suppose one possibility is that for some historical reason wage differential graphs are always presented in this format. That sort of thing sometimes happens. For example, the traditional way to draw supply and demand curves in economics is to put price on the vertical scale and demand on the horizontal scale, which swaps the dependent and independent variables from the usual scientific practice. However, since it was an economist’s blog that first brought his to my attention, this seems unlikely.

Leave a Reply